Check system health in WHM
This article will show you how to check system health in WHM
Like Server Status, the System Health category also contains a number of potentially useful tools relating to CPU usage, disk usage, and the currently running processes.
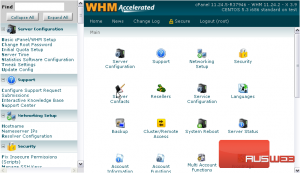
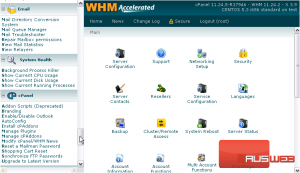
1) Scroll down to System Health in the menu.
2) Start with Show Current CPU Usage.
This page displays a sizeable list of the processes running on your server. Next to each process, you’ll see who’s running it, how much CPU and Memory it’s using, as well as the command that was used to run the process.
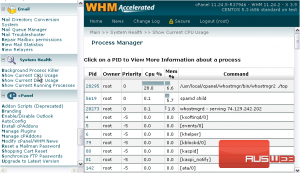
3) Click on a process’ ID to view its page.
Each process’ page displays the same information as the previous one, but you do have two links here that aren’t on that page.
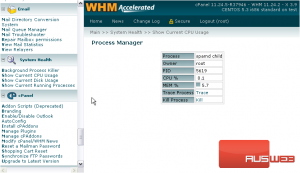
Tracing a process allows you to observe and control the process as it executes.
4) Click Trace to start tracing this process.
Killing a process is sometimes necessary when it begins using too many resources.
5) To kill this process, use the Kill link.
6) Next, let’s take a look at Show Current Disk Usage.
The first section of this page contains current disk usage information. Each partition has its own row; a partition’s total size, current usage, and available remaining space is listed next to the partition’s device name.
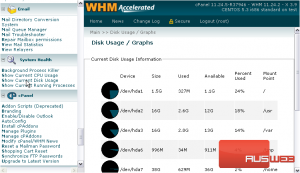
To the left of each row, you’ll see a pie graph. The colored portion depicts the percentage from the table, and both of these represent the relation of current disk usage to total size.
Mount Point is basically the path to the partition on the filesystem.
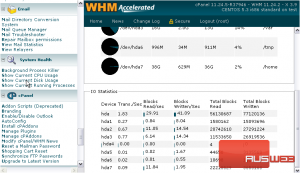
This table lists detailed Input/Ouput statistics about each hard drive and all its partitions.
7) Next, go to the last page in System Health — Show Current Running Processes.
This page is similar to the CPU Usage page, but instead shows all processes on the server in order by their process IDs.
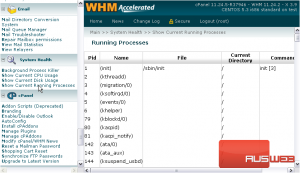
You can’t view resource usage stats here. One thing that may be useful and wasn’t on the other page is the File column, which shows the entire path to the file running the command.
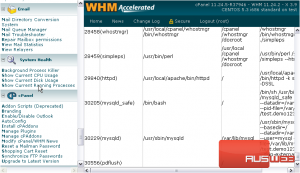
Here are a few processes you may recognize. Above is a process for WHM.
Further down the page is HTTPD, which is Apache web server. Below that are two processes for the MySQL server.
That’s all we’re going to show you from System Health right now. You’ll see how to use the Background Process Killer tool in one of the tutorials that follows.
This is the end of the tutorial. You now know how to check your system’s health in WHM.