CPU resource usage on Linux
Determine CPU resource usage on Linux server
This tutorial will show you the steps to check CPU load, memory consumption and file/folder is consuming more disk space on Linux servers.
We can use top or atop command to determine the CPU resource usage on the server. The command top will be installed on all linux servers by default.
You can use the below steps to install atop on server:
• login to the server via SSH using root login credentials and run below commands:
- Run the command and look at the output to find your Operating System version
cat /etc/*release* - Install atop if it’s not already installed
|
OS
|
Command
|
|
|---|---|---|
| CentOS_5 |
|
|
| CentOS_6 |
|
|
| CentOS_7 |
|
A. Steps to determine CPU load on the Linux server using Top command:
Linux “top” command displays processor activity of your Linux box and also displays tasks managed by kernel in real-time. It’ll show processor and memory are being used and other information like running processes.
Linux command to check CPU usage : >> top
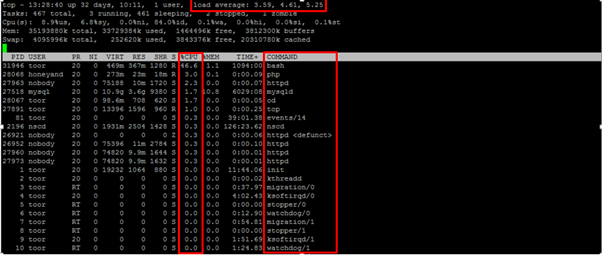
What Information Is Shown:
The following information is displayed when you run the Linux top command:
Load Average will display the average load over the last one minute, the last five minutes, and the last fifteen minutes.
The COMMAND(top) or CMD(atop) section will display the scripts which are consuming more CPU resources on the server.
B. Steps to determine CPU load on the Linux server using Atop command
Atop is a full screen performance monitor that can report the activity of all processes, even the ones that have been completed. Atop also allows you to keep daily log of system activities. The same can be used for different purposes, including analysis, debugging, pinpointing the cause of a system overload and other
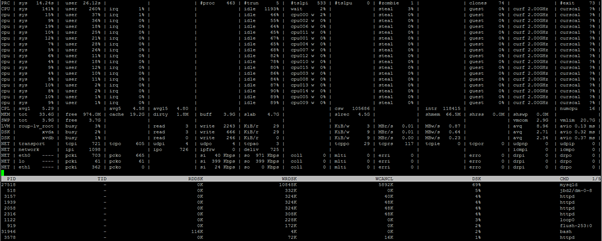
Linux command to check the CPU usage using atop: >> atop –c
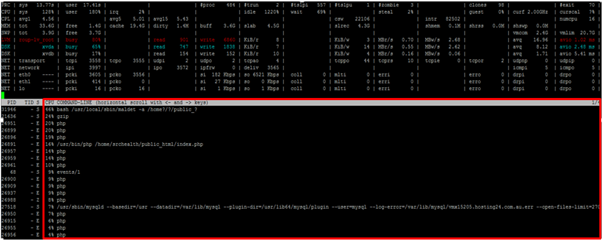
As you can see, that’s a lot of information out of which some of the terms are explained below :
PRC: This line contains the total CPU time consumed in system mode (‘sys’) and in user mode (‘user’), the total number of processes present at this moment (‘#proc’), the total number of threads present at this moment in state ‘running’ (‘#trun’), ‘sleeping interruptible’ (‘#tslpi’) and ‘sleeping un-interruptible’ (‘#tslpu’), the number of zombie processes (‘#zombie’), the number of clone system calls (‘clones’), and the number of processes that ended during the interval (‘#exit’, which shows ‘?’ if process accounting is not used).
CPU: This line contains the percentage of CPU time spent in kernel mode by all active processes (‘sys’), in user mode (‘user’) for all active processes (including processes running with a nice value larger than zero), for interrupt handling (‘irq’) including softirq, as well as the percentage of unused cpu time while no processes were waiting for disk-I/O (‘idle’) and while at least one process was waiting for disk-I/O (‘wait’). In case of a multi-processor system, an additional line is shown for every individual processor (with ‘cpu’ in lower case), sorted on activity.
CPL: This line contains CPU load information – the number of threads that are available to run on a CPU (i.e. part of the runqueue) or that are waiting for disk I/O, the number of context switches (‘csw’), the number of serviced interrupts (‘intr’) and the number of available CPUs.
MEM: This line contains information related to memory consumption — the total amount of physical memory (‘tot’), the amount of memory which is currently free (‘free’), the amount of memory in use as page cache (‘cache’), the amount of memory within the page cache that has to be flushed to disk (‘dirty’), the amount of memory used for filesystem meta data (‘buff’) and the amount of memory being used for kernel malloc’s (‘slab’).
SWP: This line contains the total amount of swap space on disk (‘tot’) and the amount of free swap space (‘free’), the committed virtual memory space (‘vmcom’), and the maximum limit of the committed space (‘vmlim’)
DSK: This line contains information related to disk utilization — the portion of time that the unit was busy handling requests (‘busy’), the number of read requests issued (‘read’), the number of write requests issued (‘write’), the number of KiBytes per read (‘KiB/r’), the number of KiBytes per write (‘KiB/w’), the number of MiBytes per second throughput for reads (‘MBr/s’), the number of MiBytes per second throughput for writes (‘MBw/s’), the average queue depth (‘avq’) and the average number of milliseconds needed by a request (‘avio’) for seek, latency and data transfer.
NET: This is the information related to Network utilization (TCP/IP) — one line is shown for activity of the transport layer (TCP and UDP), one line for the IP layer, and one line per active interface.
The system level information is followed by process level information, which as the name suggests details information related to the processes from which the resource utilization has changed during the last interval (a default interval is 10 seconds).
An important point worth mentioning is that atop uses colours (red, cyan, and more) to indicate the criticality of the resource consumption on system level. For example, when a resource exceeded its critical occupation percentage, the entire screen line is coloured RED.
2. Steps to check the Memory usage on the server:
This is the amount of RAM that has been used by the Linux server. It is often important to check memory usage and memory used per process on servers so that resources do not fall short and users are able to access the server. For example a website. If you are running a webserver, then the server must have enough memory to serve the visitors to the site. If not, the site would become very slow or even go down when there is a traffic spike, simply because memory would fall short. Its just like what happens on your desktop PC.
The free command is the most simple and easy to use command to check memory usage on linux. >> free or free –m

The linux command “free –m” will display total assigned memory, used memory and free memory details in MB’s.
You can also use top or atop command to check the memory usage using below command:
/proc/meminfo
The next way to check memory usage is to read the /proc/meminfo file. Know that the /proc file system does not contain real files. They are rather virtual files that contain dynamic information about the kernel and the system.

3. Steps to check the Disk space usage on the server:
Linux commands to check the Disk space usage >> df -h
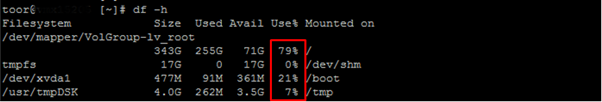
In the above screenshot, you can check the disk space usage on the linux server based on folder information.
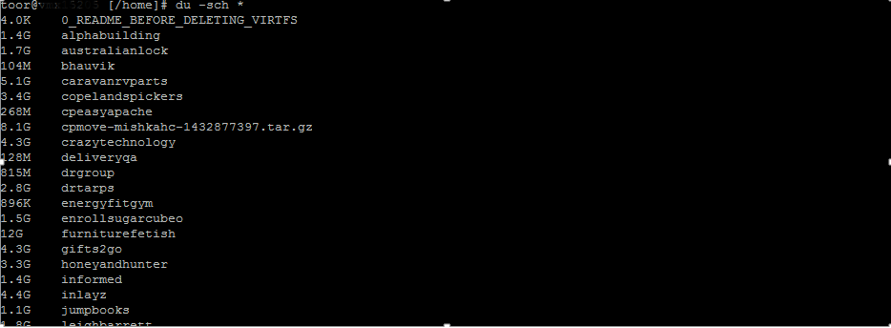
You can use the command “cd /” to jump to the root(/) folder and use the command “du –sch * ” to view the disk usage details of all the files under root folder(/).
You can also use the command “atop -d” to check the disk space usage on the server.
You can see the total CPU, memory and disk space usage in percentage values then check which script is consuming higher resources on the server. Based on these details, you can take necessary action to optimize the website.
You can also refer the website: https://gtmetrix.com to check the recommendations for optimizing the website script.
Or, you can contact our sales team by sending an email to [email protected] to increase the CPU resources on your server.